Adiabatic temperature rise (ATR) testing measures the heat-generation signature of a specific mass concrete mix under near-zero-heat-loss conditions, and it is the single input every dam thermal control model depends on. The standard protocol is USBR Procedure 4911, with semi-adiabatic alternatives defined by RILEM TC 119-TCE and Indian temperature-control guidance in IS 14591.
Every thermal control plan for a mass concrete dam rests on a single laboratory measurement: the adiabatic temperature rise curve. The finite element thermal model needs it as an input. The placement temperature ceiling depends on it. The post-cooling pipe spacing and circulation schedule are derived from it. Get the ATR data wrong and the cooling design is wrong; get it right and the rest of the thermal control plan follows arithmetic.
Despite this centrality, the test itself is rarely explained at the practitioner level. The ATR test isolates the heat-generation signature of a specific mass concrete mix from every other thermal variable that operates in the field. The protocol is USBR Procedure 4911 in the United States, with international consensus thresholds in RILEM TC 119-TCE, Indian guidance in IS 14591 (Temperature Control of Mass Concrete for Dams), and a parallel cement-paste test family in ASTM C1702 and IS 4031 Part 9. This brief walks the protocol, sets out the parameter extraction, quantifies how SCMs change the curve, lists the common test errors, and shows how the result feeds the thermal control plan.
Where does ATR sit in the thermal control workflow?
A typical dam concrete thermal control workflow has five sequenced inputs.
| Step | Input | Source |
|---|---|---|
| 1 | Project-specific concrete mix | Approved design mix per ACI 211 / IS 10262 |
| 2 | Adiabatic temperature rise curve | Laboratory test, this brief |
| 3 | Thermal properties (k, ρc, α) | Companion lab tests on the same mix |
| 4 | Boundary conditions | Site-specific placement temperature, ambient profile, formwork |
| 5 | Cooling system design | Pre-cooling and post-cooling per IS 14591 / ACI 207 |
The ATR curve at Step 2 is unique because it is the only step that captures the heat-generation kinetics of the specific cement-SCM-aggregate-admixture combination on the project. Thermal conductivity (k), density (ρ), and specific heat (c) can be estimated from aggregate type with reasonable accuracy. Boundary conditions are measured on site. The ATR curve cannot be reliably estimated from cement chemistry alone because the actual concrete kinetics depend on the interaction of cement composition, SCM type and percentage, aggregate type, water content, admixture system, and curing temperature.
The two routes to obtaining ATR data are direct testing (USBR 4911) and surrogate testing (semi-adiabatic methods, isothermal cement-paste calorimetry, or literature mapping). The choice depends on project value, schedule, and lender requirements.
The USBR 4911 protocol step by step
USBR Procedure 4911 sits in the U.S. Bureau of Reclamation Concrete Manual Part 2, 9th edition (1992). It is the most widely-cited reference for direct measurement of mass concrete adiabatic temperature rise.
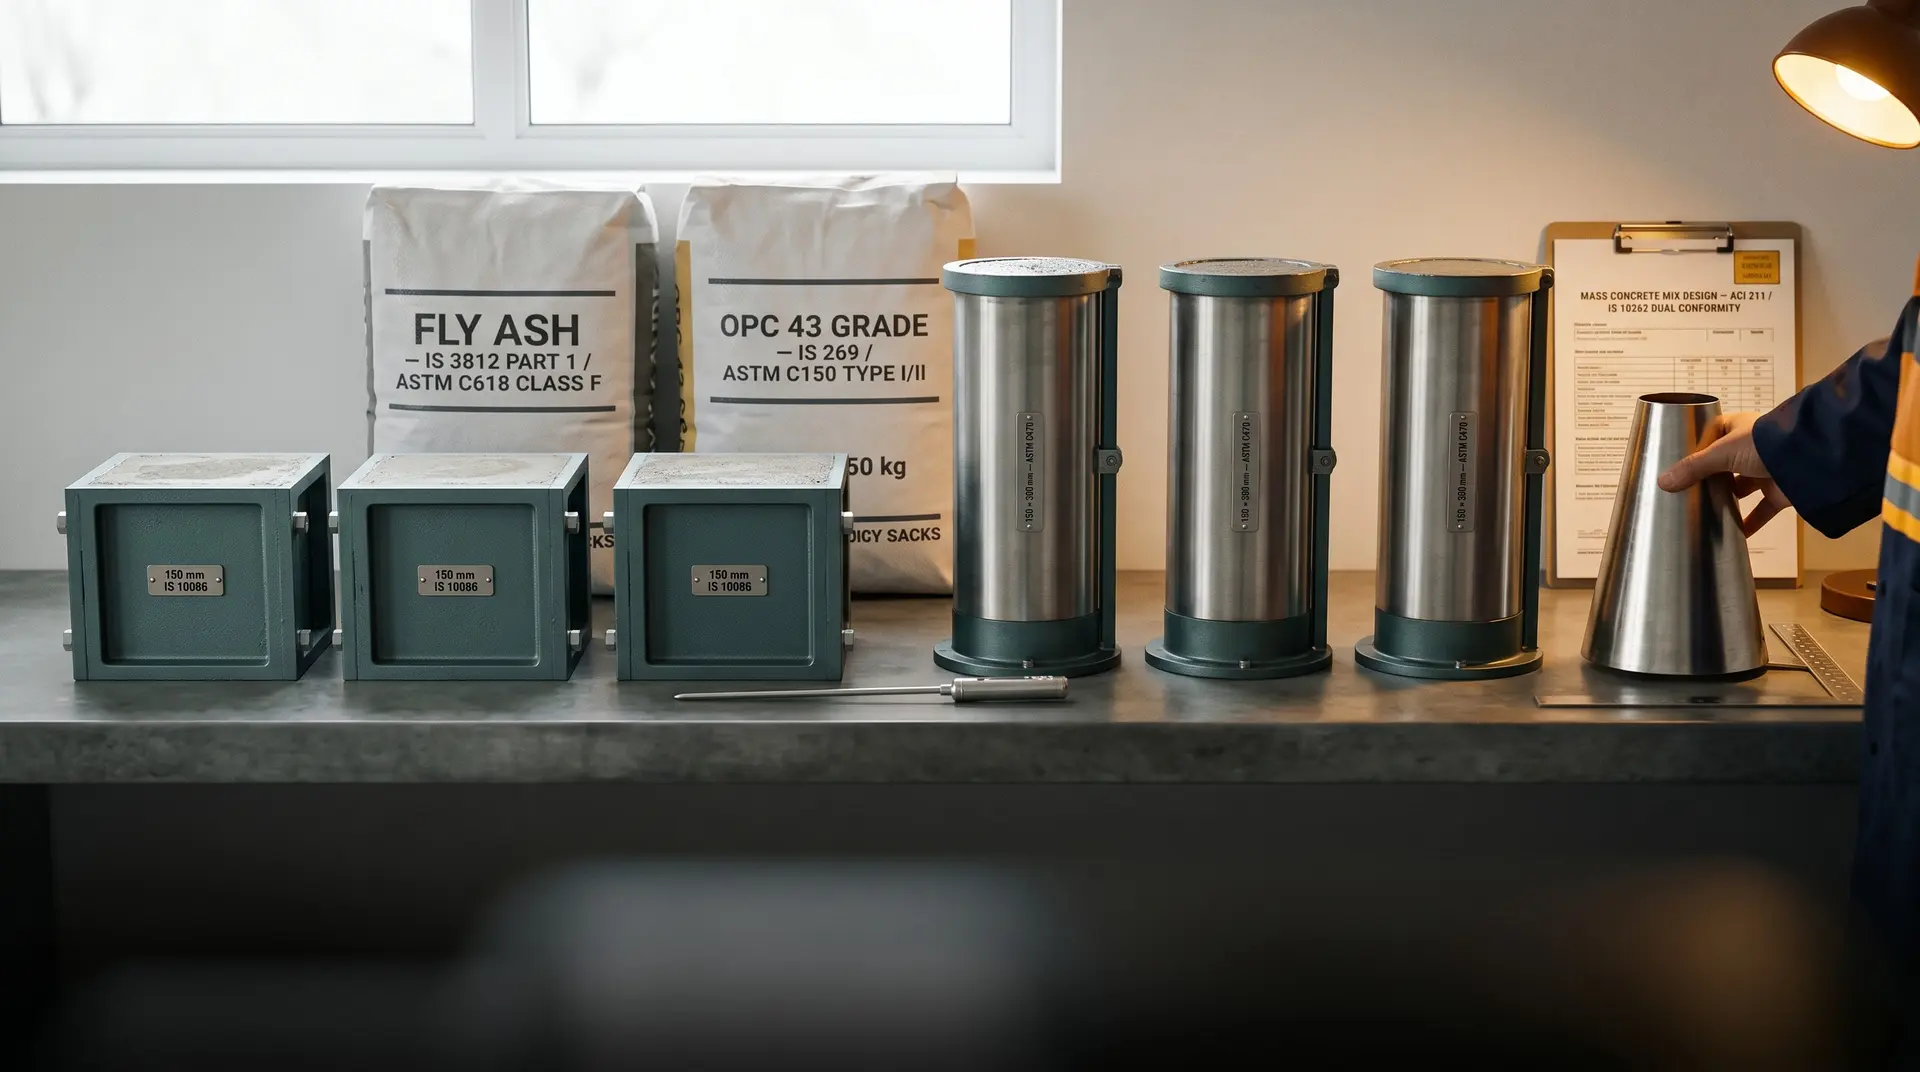
Specimen preparation
A cylindrical concrete specimen 21.5 inches in diameter by 21.5 inches tall, approximately 700 lb (318 kg) in mass and 4.52 ft³ (128 L) in volume, is cast from the project’s design mix. The mix is batched to the actual project specification with the actual project materials (cement, fly ash, coarse and fine aggregate, water, admixtures). Casting follows standard mass concrete practice with appropriate consolidation. The specimen is wrapped in polyurethane insulation rated R = 31.8 and moved to the calorimeter chamber within 30 minutes from the start of mixing.
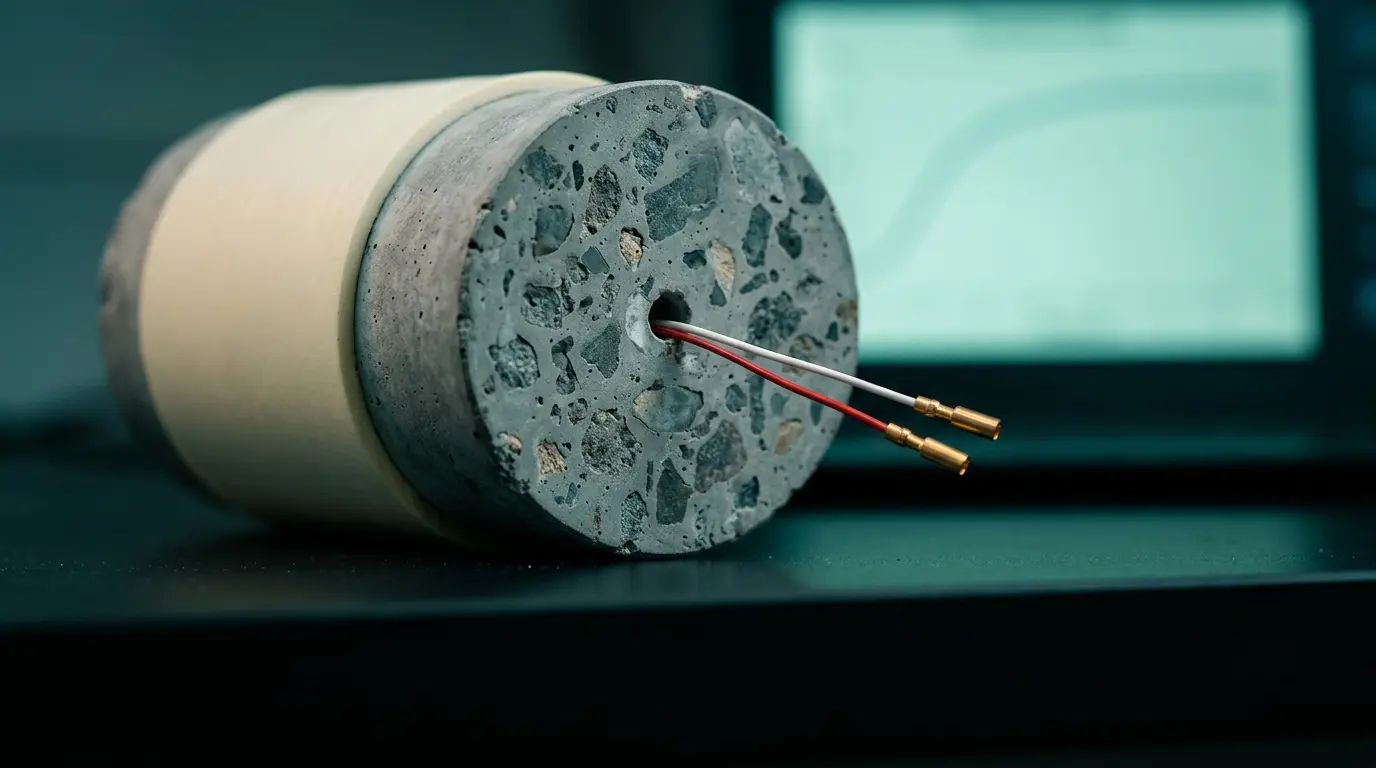
Instrumentation
Two platinum RTDs (resistance temperature detectors) are embedded at the centre of the specimen for redundant temperature measurement. Platinum RTDs are preferred over thermocouples for long-duration tests because of their long-term stability. The calorimeter chamber has its own jacket-temperature sensor and heater system.
Calorimeter operation
The calorimeter chamber maintains “near-adiabatic” conditions by continuously matching the jacket temperature to the specimen temperature. As the specimen generates hydration heat, the jacket warms to track it, supplying just enough external heat to prevent any heat loss from the specimen. RILEM TC 119-TCE caps acceptable temperature loss at 0.02 K per hour for true adiabatic operation; any greater loss disqualifies the result as adiabatic and requires correction.
Data recording and duration
Temperatures are logged at frequent intervals (typically every 15-30 minutes for the first 24 hours, then hourly thereafter). The test runs 56 days or longer, until the temperature plateau confirms ultimate temperature rise has been reached. Many high-SCM mass concrete mixes are still rising slowly at 60 days; the test is extended until the daily rise is negligible (typically < 0.1°C per day).
The specimen size question
Lee et al. (2014) documented that commercially-available smaller-specimen ATR equipment yields measurably different results from the full USBR 4911 specimen. The 21.5 by 21.5 inch size is calibrated for mass concrete with up to 75-150 mm aggregate. PCCI's standard practice on dam projects is full USBR 4911 sizing for project-specific qualification.
Companion fresh-concrete tests
At casting, fresh tests are run in parallel: slump per ASTM C143 / IS 1199, air content per ASTM C231, unit weight per ASTM C138, and fresh concrete temperature per ASTM C1064. C1064 specifies sensor accuracy of ±0.5°C in the 0-50°C range, with at least 75 mm of concrete cover around the sensor.
Parameter extraction: ΔT_∞ and τ
The raw ATR curve is a temperature-vs-time history. To use it in a finite element thermal model the curve is fitted to a parametric form.
The single-exponential model
The most common fitting model is:
ΔT(t) = ΔT_∞ × (1 − exp(−t / τ))
Where:
- ΔT_∞ is the ultimate temperature rise (the asymptote the curve approaches as time goes to infinity).
- τ is the time constant. At t = τ, the rise reaches 63.2% of ΔT_∞.
The single-exponential fit captures the basic shape of the curve but tends to understate the rapid acceleration phase of the first 24-48 hours.
The hyperbolic model
ΔT(t) = ΔT_∞ × t / (a + t)
The hyperbolic is mathematically simple and produces a similar curve shape, with the constant a playing a role similar to τ.
The Zhu composite exponential model
For mass concrete with strong SCM presence, the Zhu composite exponential model is widely used in Chinese and Japanese dam practice. It combines two exponentials with different time constants:
ΔT(t) = ΔT_∞,1 × (1 − exp(−t / τ_1)) + ΔT_∞,2 × (1 − exp(−t / τ_2))
The first term captures the rapid OPC-dominated hydration; the second captures the slower SCM-dominated late hydration. The composite model fits high-fly-ash and high-slag mass concrete curves significantly better than the single-exponential.
Typical fitted values for dam mass concrete
| Mix type | ΔT_∞ typical range | τ typical range |
|---|---|---|
| 100% OPC (Type I / IS 269) | 40-50°C | 1-2 days |
| OPC + 30% fly ash | 32-42°C | 2-4 days |
| OPC + 40% fly ash | 28-38°C | 3-5 days |
| OPC + 50% fly ash | 25-35°C | 4-7 days |
| OPC + 75% slag | 28-38°C | 3-5 days |
| Low-heat OPC (IS 12600 / ASTM Type IV) | 28-38°C | 2-3 days |
Values are typical ranges for South Asian dam concrete practice based on multiple project records. Project-specific values depend on cement composition, SCM source, aggregate type, and curing temperature.
How do SCMs change the ATR curve?
Fly ash, slag, and silica fume modify the ATR curve in three distinct ways.
Reduced ultimate temperature rise
Fly ash has lower heat of hydration per unit mass than ordinary Portland cement. At 40% fly ash replacement by mass of cementitious, peak temperature is typically reduced by approximately 20% relative to a 100% OPC reference mix. At 50% replacement the absolute reduction grows but the marginal benefit slows. Slag at 75% replacement gives approximately the same heat-reduction as 30% fly ash. Silica fume at the small replacement percentages used (5-10%) does not significantly change ΔT_∞ but can affect the early-age rate.
Extended time constant
Fly ash and slag hydrate more slowly than OPC, so the temperature rise is spread over a longer period. Time constant τ extends from ~1-2 days for high-OPC mixes to ~4-7 days for high-fly-ash mixes. The lower peak rate of heat generation reduces thermal-cracking risk because the temperature gradient across the lift develops more slowly, giving more time for stress relaxation.
The temperature-ceiling effect
Above approximately 60-70°C concrete temperature, fly ash pozzolanic reactivity rises sharply because the pozzolanic reaction is thermally activated. In a real mass concrete placement that reaches 70°C, the fly ash contribution to heat generation can increase, partially offsetting the cooling benefit observed in the laboratory at lower temperatures. The implication: ATR tests run at the project’s expected placement temperature give more reliable input data than tests run at standard laboratory ambient.
Cement specifications relevant to ATR
Cement composition is the primary determinant of OPC-only heat of hydration.
| Cement type | Heat of hydration spec | Typical 7-day heat (kJ/kg) |
|---|---|---|
| ASTM C150 Type I | No specification | 320-380 |
| ASTM C150 Type II (moderate heat) | ≤ 290 kJ/kg at 7 days (optional) | 280-320 |
| ASTM C150 Type IV (low heat) | ≤ 250 kJ/kg at 7 days | 200-250 |
| IS 269 OPC 43 / 53 grade | No specification | 320-380 |
| IS 12330 Sulphate resisting | No direct heat spec | Comparable to Type II |
| IS 12600 Low heat Portland | ≤ 272 kJ/kg (65 cal/g) at 7 days; ≤ 314 kJ/kg (75 cal/g) at 28 days | 230-272 |
The cement-paste heat of hydration measured per IS 4031 Part 9 (Indian) or ASTM C1702 (current, replaces withdrawn ASTM C186) is not directly the concrete ATR but is correlated. It is used for cement-source qualification at the start of a project.
Semi-adiabatic alternatives
Full USBR 4911 testing has three practical constraints: high equipment cost, large specimen size, and 3-4 month total turnaround including mobilisation. Several semi-adiabatic alternatives are widely used.
Langavant calorimeter (EN 196-9)
The Langavant calorimeter measures cement mortar heat of hydration in a thermos-flask-style enclosure. Used widely in Europe for cement-source qualification. Per RILEM TC 119-TCE, the calorimeter qualifies as semi-adiabatic if heat losses are below 100 J per hour per Kelvin.
TAM Air isothermal calorimetry
The TA Instruments TAM Air calorimeter holds cement paste at constant temperature and measures the heat flow required to maintain that temperature. It tests under ASTM C1702 conditions, with heat flow accuracy of ±8 μW and thermostat accuracy of ±0.02°C. Routine cement-source qualification at most modern labs uses TAM Air or equivalent isothermal calorimetry.
Calmetrix iCal semi-adiabatic
Calmetrix iCal instruments are field-portable semi-adiabatic calorimeters that can run on cement paste or mortar specimens.
The 1-metre cube semi-adiabatic field test
For on-site verification of delivered mass concrete, a 1-metre cube cast adjacent to the actual placement, instrumented with thermocouples at the centre and surfaces and wrapped in insulation, gives a usable semi-adiabatic indication of the heat-generation profile of the delivered mix. The cube is not adiabatic but the heat-loss correction is straightforward.
The practitioner choice on a dam project is usually: USBR 4911 for project-specific qualification of the dam concrete mix at the start, Langavant or TAM Air for routine cement-source verification, and the 1-metre cube for on-site delivery verification.
How ATR data feeds the FEA thermal model
The fitted ATR parameters serve as the volumetric heat-generation input function in finite element thermal models such as DIANA, ANSYS, ABAQUS, MIDAS, or JCMAC3.
The standard workflow:
- The project mix is qualified through an ATR test. The raw curve is fitted to the single-exponential, hyperbolic, or Zhu composite model to extract ΔT_∞ and τ (and ΔT_∞,2, τ_2 if composite).
- The Arrhenius activation energy is determined or assumed. Typical values: 33-44 kJ/mol for OPC, modified for SCMs (fly ash typically 35-45 kJ/mol, slag 40-50 kJ/mol). The activation energy allows the model to convert between adiabatic-condition data and the heat-generation rate at any other temperature via the equivalent-age concept.
- The fitted heat-generation function is implemented in software. The volumetric heat-generation rate at each finite element is computed from the local temperature history.
- The model solves the heat-conduction equation with boundary conditions: placement temperature, ambient temperature profile, formwork thermal resistance, and cooling pipe flow rate and water temperature where applicable.
- The output is the predicted temperature field through the dam lift over time.
The model output drives engineering decisions. Peak temperature must stay below the specification ceiling (typically 70°C per ACI 301). The core-to-surface differential must stay below the cracking threshold (typically 19.4°C per ACI 207). The temperature-time history determines maturity and early-age strength development.
Without project-specific ATR data the model rests on generic literature values that may produce errors of 5-10°C in predicted peak temperature, which is enough to invalidate the cooling design. For the modelling step that consumes the ATR data, see thermal modelling and finite element analysis for mass concrete. For the cooling-system designs that depend on the model output, see pre-cooling concrete dams methods and post-cooling embedded pipes for mass concrete dams.
What are the most common ATR test errors?
Five categories of error recur across dam projects. Each one can invalidate the test or produce a measurably wrong ΔT_∞ or τ, which in turn invalidates the FEA thermal model and the cooling design that derives from it.
Calorimeter jacket lag
The heater jacket must track the specimen temperature with minimal delay. If the jacket lags, the specimen loses heat to the jacket and the measured ΔT_∞ is under-estimated. The RILEM TC 119-TCE threshold of 0.02 K per hour acceptable heat loss is binding: any test where the documented heat loss exceeds this is not adiabatic and must either be corrected with the semi-adiabatic correction (where the heat-loss coefficient is calibrated) or rejected. PCCI’s pre-test verification: a dry-run calibration test with a known-heat-source phantom specimen, confirming the jacket tracks the heater within 0.02 K per hour over a representative range.
Sensor drift over 56+ days
Platinum RTDs and thermocouples can drift over the long test duration. The drift may be small (0.1 to 0.5°C over 60 days) but it adds directly to the apparent ΔT_∞. Pre-test calibration against an ice-point reference and a boiling-water reference at the test setup, and post-test re-calibration at the same references after the specimen is removed, is the standard discipline. Two RTDs at the specimen centre (as USBR 4911 requires) provide redundancy: if the two diverge by more than 0.2°C during the test, the data are flagged.
Premature termination
Stopping the test before the plateau is reached produces under-estimated ΔT_∞. For high-OPC mixes the plateau is typically reached at 28-40 days; for high-fly-ash mixes the curve may still be rising at 60 days and full plateau may not be reached until 90 days. The test termination criterion is normally a daily temperature rise below 0.1°C per day for at least three consecutive days. Projects that terminate early because of schedule pressure end up with extrapolated ΔT_∞ values that may be 2-5°C below the true ultimate.
Specimen-jacket coupling
Poor thermal contact at the specimen surface produces apparently-low rise because heat escapes the specimen through air gaps in the insulation. The polyurethane insulation rated R = 31.8 must be intact, uniformly applied, and free of voids. Visual inspection before the calorimeter chamber is sealed is non-negotiable. PCCI specifies a contact-foam layer or thermal grease at any RTD entry point through the insulation.
Specimen size relative to MSA
Lee et al. (2014) documented that commercially available smaller-specimen ATR equipment yields measurably different results from the full USBR 4911 specimen, with the measured ultimate temperature rise of a 50-litre specimen running roughly 17% above that of a 6-litre specimen. The 21.5 by 21.5 inch (546 mm by 546 mm) size is calibrated for mass concrete with up to 75-150 mm maximum aggregate. Smaller specimens lose proportionally more heat through the insulation because their surface-area-to-volume ratio is higher, so the measured ultimate temperature rise falls below that of a full-size specimen. The practical rule: specimen diameter should be at least 7 times the maximum aggregate size, with USBR 4911 sizing meeting this for typical mass concrete MSAs.
The pre-test phantom calibration discipline
Every ATR test should be preceded by a phantom-specimen calibration run where a known electrical heat source replaces the concrete specimen. The measured temperature rise should match the input power closely. Calorimeters that fail phantom calibration cannot be trusted for the real test, regardless of cost.
The audit trail
A defensible ATR test produces an audit trail that includes: pre-test calibration certificates for all RTDs/thermocouples; phantom-specimen calibration run; fresh-concrete test results at casting (slump, air, unit weight, temperature); calorimeter chamber log showing jacket-specimen tracking throughout; raw temperature data with timestamps; curve-fit residuals; post-test re-calibration certificates. This is the artefact the Lender’s Technical Advisor reviews when accepting the project thermal control plan.
Indian context: capability, lead time, and cost
ATR testing capability in India is limited but real. CSMRS (Central Soil and Materials Research Station, New Delhi), CWPRS (Central Water and Power Research Station, Pune), and a handful of academic and corporate dam-project labs operate full-scale or near-full-scale adiabatic calorimeters. Some private testing houses partner with overseas labs for the full USBR 4911 protocol.
Typical lead time for a USBR 4911 ATR test cycle is 3-4 months end-to-end: 2-4 weeks for mobilisation and specimen design approval, 2-3 days for casting and instrumentation, 56-90 days for the test itself, and 2-3 weeks for curve fitting and reporting. Project schedules that do not budget this lead time at design stage end up using literature values or semi-adiabatic surrogates.
Cost varies but a single full ATR mix qualification in India is typically in the INR 5-15 lakh range, with multi-mix portfolios (the dam usually needs 3-5 distinct ATR signatures for different mix grades and zones) running INR 25-50 lakh for the full qualification programme. The cost is small relative to the cost of getting the cooling design wrong on a 10 lakh cubic metre dam concrete placement.
How PCCI uses ATR results on dam projects
PCCI’s leadership has delivered thermal parameter qualification on hydropower dam projects in three countries, anchored in the project-specific ATR-based workflow. The MD’s authorship of IS 14591 (Temperature Control of Mass Concrete for Dams) is the technical backbone of PCCI’s thermal control practice. On the Tanahu Hydropower Project (140 MW, Nepal), PCCI delivered thermal parameter qualification for the mass concrete blocks under the ACI/ASTM framework, including project-specific ATR signature qualification for the high-fly-ash low-cement mass concrete mix. On Bhutan projects including Tala, Mangdechhu, and Punatsangchhu-1, the same workflow applied under the IS framework with ACI 207 cross-references.
The work product on a typical engagement covers:
- Pre-test ATR programme design specifying USBR 4911 vs semi-adiabatic surrogate, mix portfolio, specimen schedule, and lab sourcing.
- Test witnessing and quality assurance for casting, instrumentation, and calorimeter operation.
- Curve fitting and parameter extraction in single-exponential, hyperbolic, and Zhu composite forms.
- FEA model input preparation including activation energy determination and equivalent-age formulation.
- Cooling system design driven by the model output (placement temperature ceiling, pipe spacing, water circulation schedule).
- On-site verification through 1-metre cube semi-adiabatic field tests on production concrete, closing the loop with embedded thermal instrumentation that checks the model’s predicted temperature field against field readings.
The result is a thermal control plan whose central input (the ATR curve) is project-specific rather than literature-derived, and whose downstream design decisions (pre-cooling target, pipe spacing, lift height, placement schedule) are defensible at the Lender’s Technical Advisor review.
Closing: the test that anchors the thermal plan
ATR testing is the single most-cited input to mass concrete thermal control design and the single least-explained part of the practitioner workflow. The USBR 4911 protocol, the RILEM adiabatic/semi-adiabatic thresholds, the single-exponential and Zhu composite curve fits, the fly ash and slag effects, and the Arrhenius activation energy treatment together define the data pipeline that ends in a cooling-system design.
PCCI’s thermal control and placement engineering service delivers project-specific ATR-based thermal qualification for dam mass concrete on multilaterally-funded hydropower projects. For independent review of an existing thermal control plan, particularly to assess whether the ATR data underlying the cooling design is genuinely project-specific or borrowed from literature, the Owner’s Engineer / Independent Review service provides a senior-practitioner second opinion.
Test the actual mix. Fit the actual curve. Run the actual model. That is the discipline that keeps dam concrete temperatures under control through every lift placed.